How It Works

It's x-ray vision for the revenue from your website
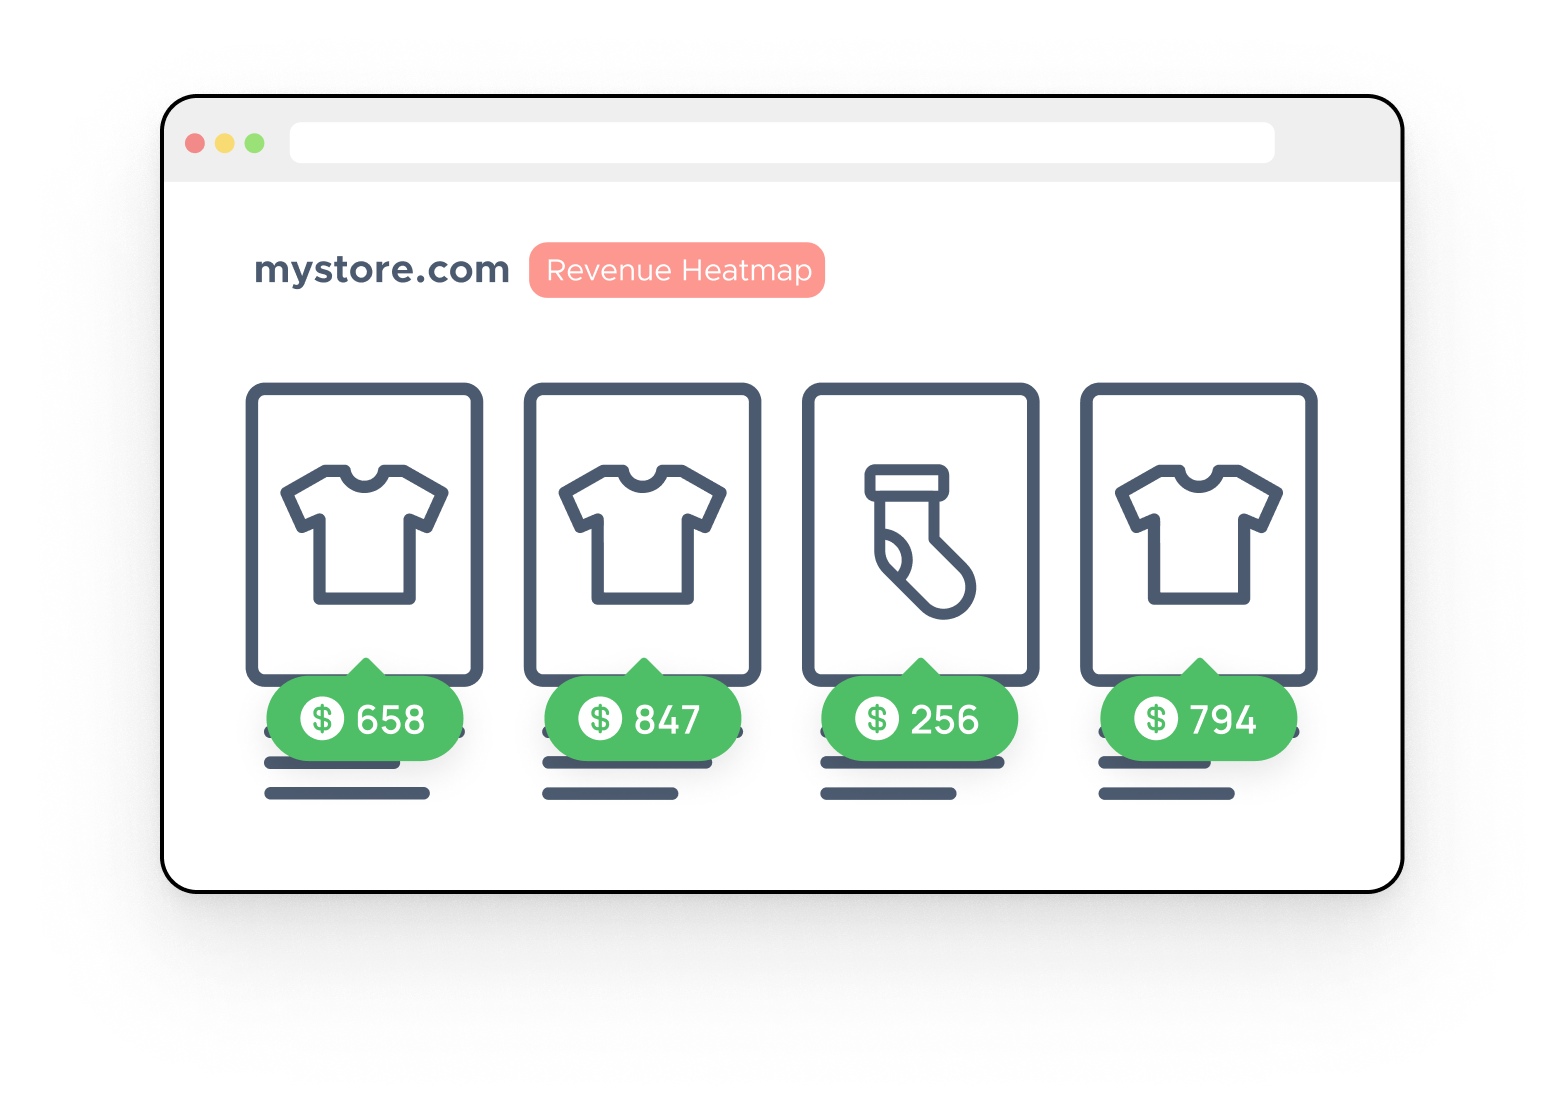
See which buttons and links turn into money.
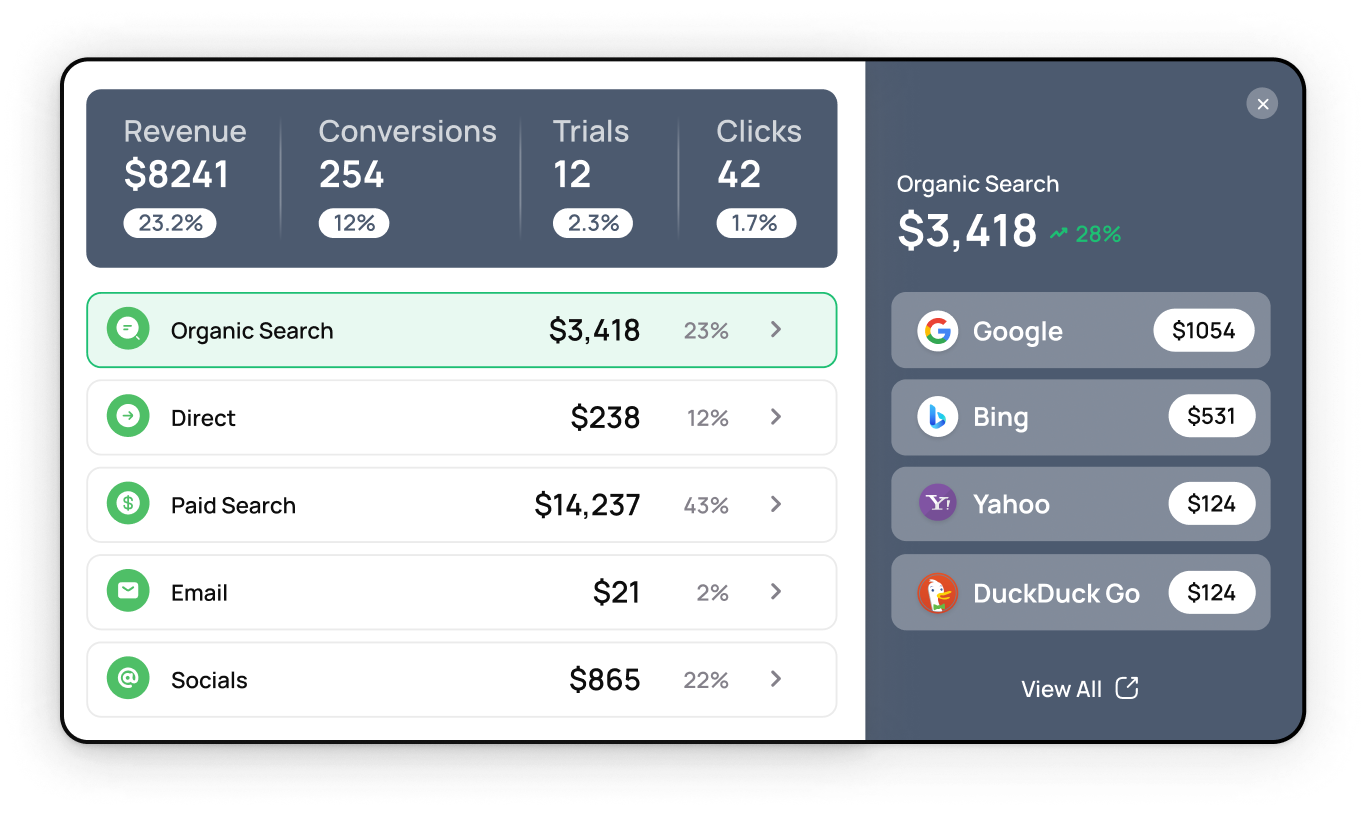
Using what we have dubbed "revenue heat maps", you can easily see exactly which buttons, links and images are generating the most revenue on your site.

Revenue data for every link on a page.
Click data on every link on a page.
Conversion tracking connected to each button and link.
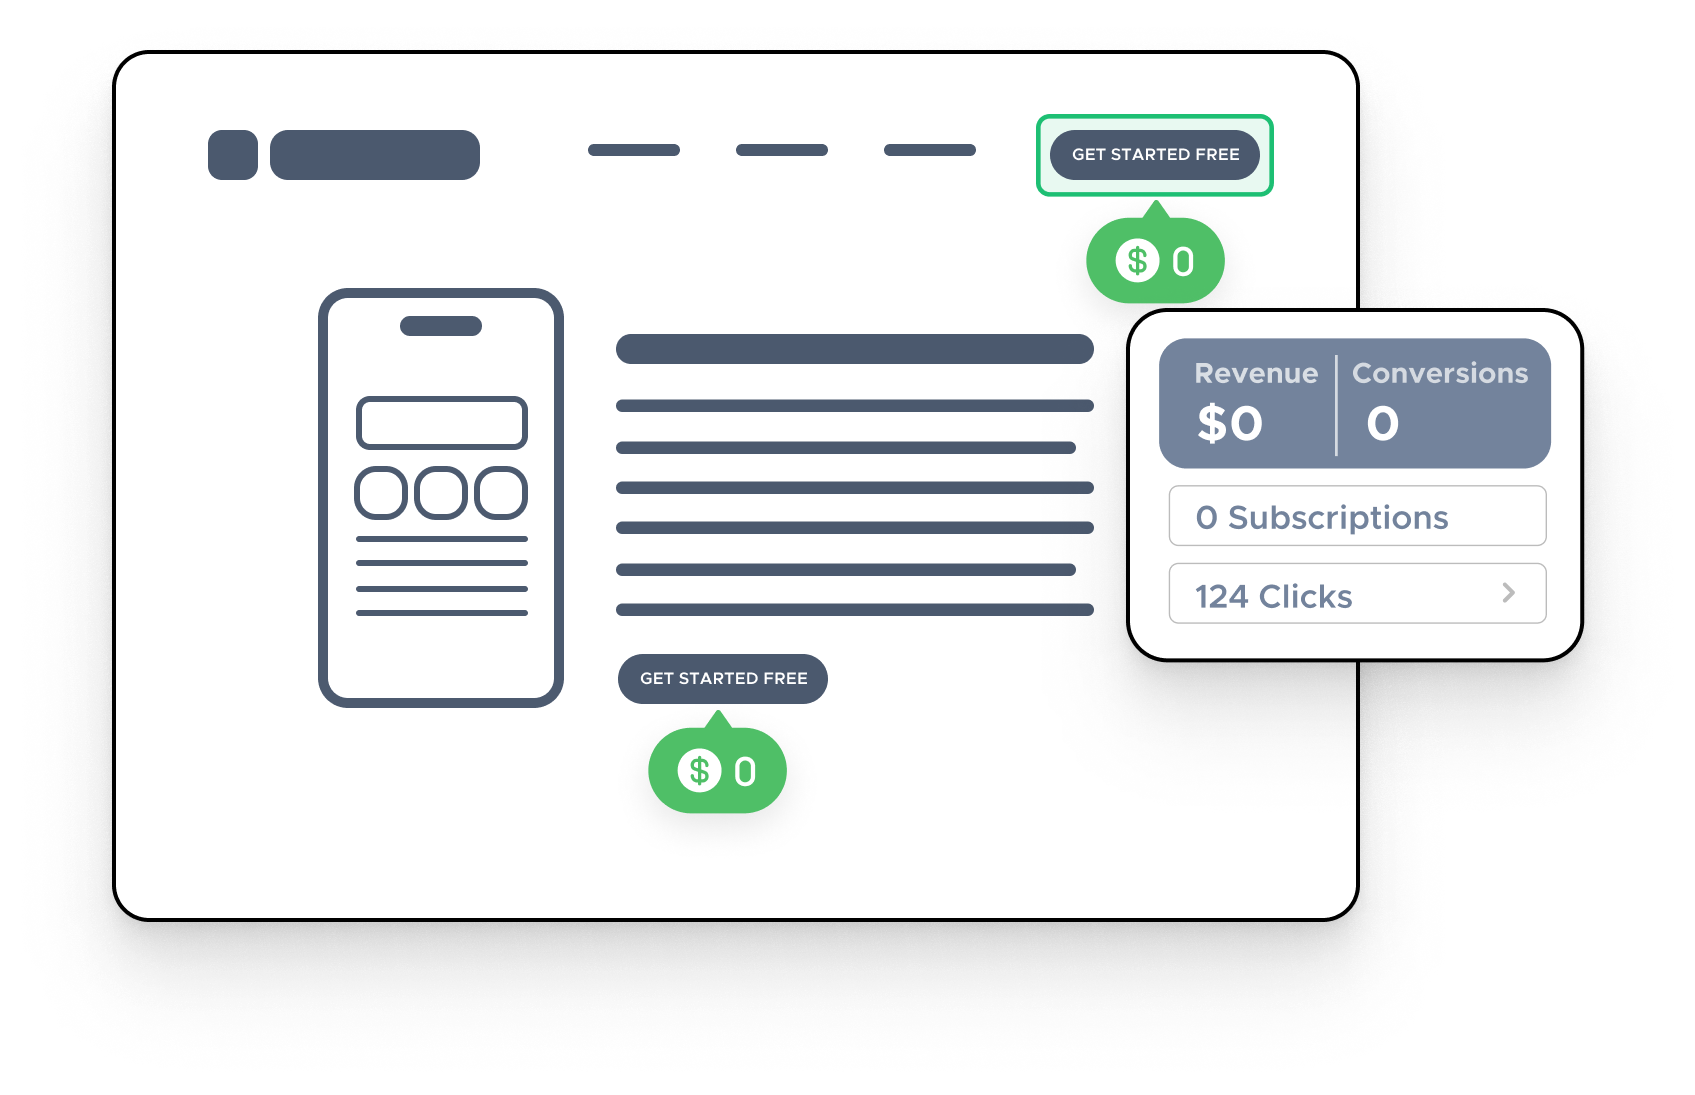
See if your call to action buttons are working.
There's nothing worse than a Call To Action that doesn't get potential customers to act. SquidVision exposes bad CTAs in just days.
See how much revenue a CTA generates.
See if a CTA only attracks lurkers.
Make tweaks to CTAs to increase conversions.
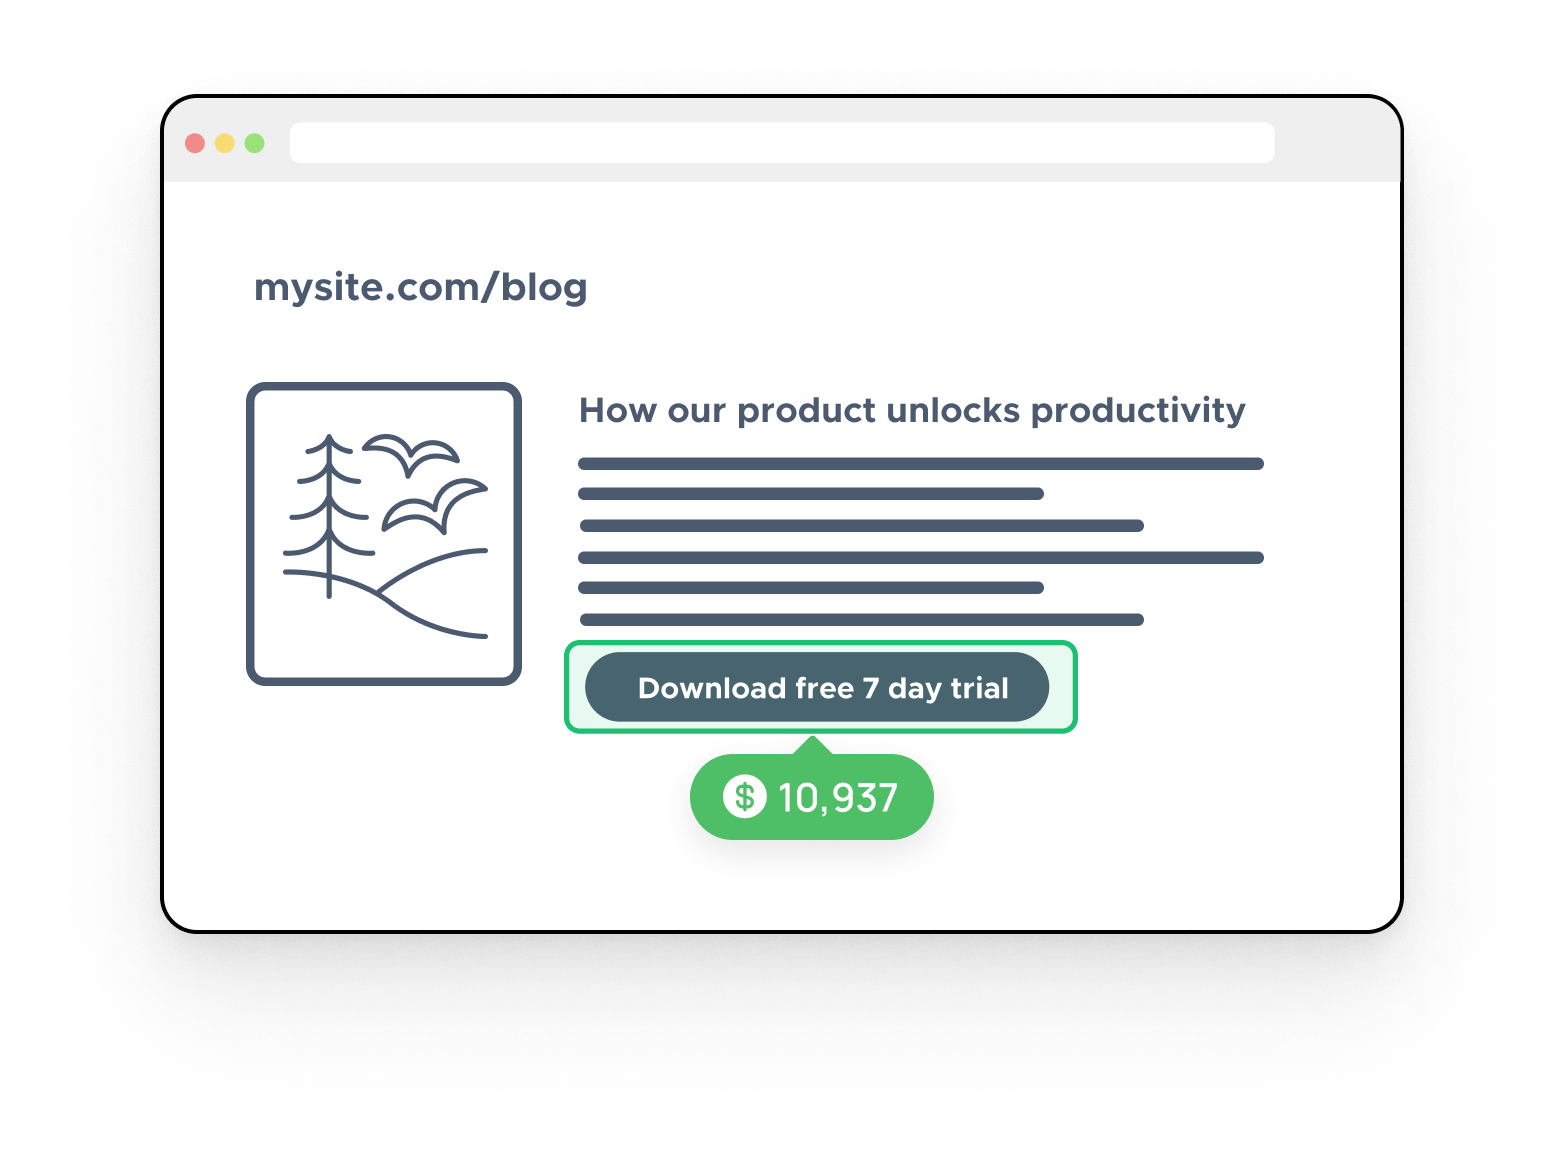
See the $ value of CTAs in your blog content.
Trying to drive traffic and sales from your blog posts? Now you can track how much revenue each post generates for you.
Audit your content marketing.
See which blog posts attract buyers.
Know which content to promote.
In-depth revenue and click insights for every button and link. (Coming Soon)
Using what we have dubbed "revenue heat maps", you can easily see exactly which buttons, links and images are generating the most revenue on your site.
Revenue data for every link on a page.
Click data on every link on a page.
Conversion tracking connected to each button and link.
Ready to blow up your MRR?
Start increasing conversions on your landing pages and blogs posts today.