.png)
Best heatmap tools 2023: A Quick and Comprehensive Guide
New mobile apps to keep an eye on
Auctor purus, aliquet risus tincidunt erat nulla sed quam blandit mattis id gravida elementum, amet id libero nibh urna nisi sit sed. Velit enim at purus arcu sed ac. Viverra maecenas id netus euismod phasellus et tempus rutrum tellus nisi, amet porttitor facilisis aenean faucibus eu nec pellentesque id. Volutpat, pellentesque cursus sit at ut a imperdiet duis turpis duis ultrices gravida at aenean amet mattis sed aliquam augue nisl cras suscipit.
- Commodo scelerisque convallis placerat venenatis et enim ullamcorper eros.
- Proin cursus tellus iaculis arcu quam egestas enim volutpat suspendisse
- Sit enim porttitor vehicula consequat urna, eleifend tincidunt vulputate turpis
What new social media mobile apps are available in 2022?
At elit elementum consectetur interdum venenatis et id vestibulum id imperdiet elit urna sed vulputate bibendum aliquam. Tristique lectus tellus amet, mauris lorem venenatis vulputate morbi condimentum felis et lobortis urna amet odio leo tincidunt semper sed bibendum metus, malesuada scelerisque laoreet risus duis.

Use new social media apps as marketing funnels
Ullamcorper pellentesque a ultrices maecenas fermentum neque eget. Habitant cum esat ornare sed. Tristique semper est diam mattis elit. Viverra adipiscing vulputate nibh neque at. Adipiscing tempus id sed arcu accumsan ullamcorper dignissim pulvinar ullamcorper urna, habitasse. Lectus scelerisque euismod risus tristique nullam elementum diam libero sit sed diam rhoncus, accumsan proin amet eu nunc vel turpis eu orci sit fames.
- Eget velit tristique magna convallis orci pellentesque amet non aenean diam
- Duis vitae a cras morbi volutpat et nunc at accumsan ullamcorper enim
- Neque, amet urna lacus tempor, dolor lorem pulvinar quis lacus adipiscing
- Cursus aliquam pharetra amet vehicula elit lectus vivamus orci morbi sollicitudin
“Sit enim porttitor vehicula consequat urna, eleifend tincidunt vulputate turpis, dignissim pulvinar ullamcorper”
Try out Twitter Spaces or Clubhouse on iPhone
Nisi in sem ipsum fermentum massa quisque cursus risus sociis sit massa suspendisse. Neque vulputate sed purus, dui sit diam praesent ullamcorper at in non dignissim iaculis velit nibh eu vitae. Bibendum euismod ipsum euismod urna vestibulum ut ligula. In faucibus egestas dui integer tempor feugiat lorem venenatis sollicitudin quis ultrices cras feugiat iaculis eget.
Try out Twitter Spaces or Clubhouse on iPhone
Id ac imperdiet est eget justo viverra nunc faucibus tempus tempus porttitor commodo sodales sed tellus eu donec enim. Lectus eu viverra ullamcorper ultricies et lacinia nisl ut at aliquet lacus blandit dui arcu at in id amet orci egestas commodo sagittis in. Vel risus magna nibh elementum pellentesque feugiat netus sit donec tellus nunc gravida feugiat nullam dignissim rutrum lacus felis morbi nisi interdum tincidunt. Vestibulum pellentesque cursus magna pulvinar est at quis nisi nam et sed in hac quis vulputate vitae in et sit. Interdum etiam nulla lorem lorem feugiat cursus etiam massa facilisi ut.
Does it not intrigue you to know why website visitors click on a particular call to action button and not on the other? And don’t you think it’s cool to analyze users' behavior to understand the design flaws of landing pages. Also, don't you wish to know how many blogs and articles each individual user goes through?
Well, the heatmap software is the key solution to the majority of your desires. Looking into information found on web pages in different ways always works. In fact, data visualization has typically existed for many decades.

The main purpose of website heatmap software tools is to understand all information on web pages clearly. It is always ideal to think of them as an imaginary layer on the top of your web page. And this typically grabs plenty of things that the users interact with and do.
For instance, whenever they scroll and navigate through any web page, they click on something that grabs their attention. Meanwhile, the users interact while carefully preserving their anonymity. And this technique is immensely crucial to survive in the present-day world.
Surprisingly, that is precisely the power of heatmap tools. Now that you are here, you will get valuable insights into various aspects of heatmap software tools. And while you dig deeper, you will find a section where heatmap software tools are reviewed. Please ensure that you stay tuned until the end to know more about it.
Let's get rolling.
What is Heatmap Software?

A heatmap software is an exclusive graphical representation of a business website and Google analytics datasets. The web pages typically use both warm and cold colors to depict essential information and historical data.
Thus, it becomes extremely easy for online marketers to assess the on-screen behavior of their website visitors. Meanwhile, the warm and cold colors typically represent emotions and user interactions.
The artists of the heatmap software tools have been using them for 200+ years. They also have the potential to illustrate visitor behavior and user feedback frequency.
For instance, the warm colors on the best heatmap tool represent the user journey on your website. In a nutshell, it significantly represents the area where the user sessions are most engaging. Meanwhile, the colder colors such as green and blue represent the ignored areas that users scroll and avoid.
Thus, looking into the detailed heatmaps session recordings is comparatively easier than a data-loaded spreadsheet. It is because spreadsheets are typically loaded with complex data sets. The best heatmap software deliberately makes the analytics features super fun and interesting.
And this is truly an efficient way for usability testing in unlimited heatmaps session recordings. That's how you can seamlessly determine your website performance and determine what works and doesn't.
Types of Heatmap Software Tool
Website owners analyze and scroll heatmaps only to acquire answers to several questions. So, in order to obtain appropriate answers and valuable insights into their queries, they use different heatmap tools. Some of them include the following:
1. Click Tracking Heatmaps

The click maps can efficiently help in analyzing which portion of your website reflects the major user behavior. Also, you can determine the exact parts of your web page that obtain the most and least clicks.
2. Traffic Segmentation Heatmaps

These dynamic heatmaps present website traffic data by categorizing the session replay into customer segments. The typical segmentation is entirely based on various demographic information, including age, location, etc.
3. Scroll Heatmaps

The scroll map typically uses warm and cold color transitions to show user behavior. Scroll maps also reveal how far a viewer scrolls to find their desired data.
The warmer section of the scroll maps also reveals user behavior and where they spend the majority of the time. Meanwhile, the colder section of scroll maps reveals the content which is mostly ignored.
4. Mobile and Desktop Heatmaps

These dynamic heatmaps are just snapshots of your desktop websites and mobile apps. So, you can easily understand how your users interact with both versions, thereby generating predictive attention heatmaps.
5. Mouse Tracking Heatmaps

These track mouse movements on a webpage. The mouse movement further uncovers and offers feedback surveys on how distracted or focused a user is on the website.
Top 5 Tools for Heatmap Analysis
By now, you must clearly know what a heatmap tool is and who requires it. In this section, we will now look into the Top 5 heatmap tools that are extremely easy to use. Apart from that, each heatmap tool offers a few-day free trial which takes easy on the pocket while dominating the current market.
They include:
1. SquidVision

SquidVision is one of the best heatmap software tools that enables you to track revenue seamlessly. Unlike most other heatmap software, SquidVision has a commendable heatmap tracking feature. And it precisely allows you to track the buttons, links, and images, further converting them and fetching you money. You can also check out whether your CTA, Call-To-Action buttons are working. Tracking the blog posts that attracts buyers is also possible with SquidVision.
Thus, the conversion funnel analysis tool is also known as revenue heatmaps. It is a typical game changer as it takes over one of the premium offerings of the competitors. Further, it packs the session replay tool into an inexpensive offering that is broadly available for all.
Pros:
- SquidVision decodes the website visitor behavior with the session recording tool. It also gives valuable insights into the most important metrics of revenue.
Cons:
- Session recording isn't available.
2. Crazy Egg

Crazy Egg provides a 30-day free trial as soon as you sign up. It provides a web-only conversion rate optimization along with web and Google analytics tools. And this is highly preferred by e-commercial giants, including Dell, eBay, Zappos, and Amazon.
The most commendable feature of Crazy Egg is that it is extremely easy to implement. And in order to get started, you need to insert a simple code into the website's HTML page. Only then are you all set and good to go. Further, you will have better insights into critical data from the session recordings and live monitoring.
Through Crazy Egg, you can conduct funnel analysis and view results in several ways. Some of them include scrolls, heatmaps, confetti, overlays, feedback tools, etc. And each view provides remarkable insights into google analytics along with several other metrics. For instance, the heatmap offers appropriate information whenever a user clicks on heatmap features.
Pros:
- It enables you to see the color-graded breakdown of how long and how far the users scroll.
- The A/B Testing Page Editor functionality of Crazy Egg allows businesses to test certain new designs before they can be implemented.
Cons:
- You must specifically track each page.
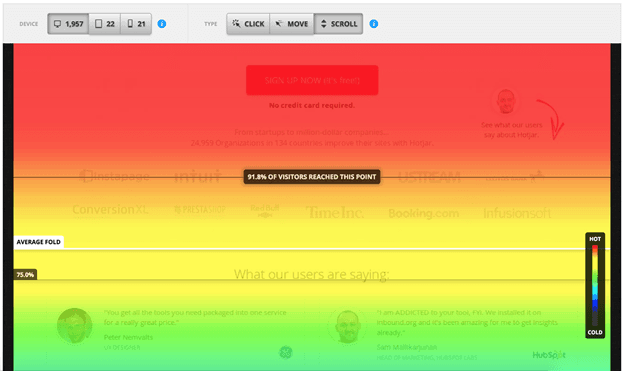
3. Hot Jar

Hotjar comes with a loyal subscriber base and is one popular heatmap tool that comprises conversion funnels. The key feature of Hot Jar is that it's immensely intuitive. Besides, it offers detailed behavior analytics by integrating with Google Tag Manager, surveys, feedback widgets, heatmaps, session recording features, etc.
One of this heatmap's most apparent key features is that it seamlessly highlights wherever the users click. It further goes on to highlight those areas where the users scroll or move on targeted website pages. This heatmap software basically comprises conversion funnels that deliberately show why and where your visitors are dropping off.
So, whenever you log into the dashboard of Hot Jar, you will find all the tools required for funnel analysis. These tools can also be used for session replays to identify the red-flag metrics. And this can be done by keeping a close watch on the behavior of the website users.
Pros:
- HotJar helps in identifying optimization opportunities, spot the issues with customer experiences, and also ensures seamless work.
Cons:
- For mobile apps, they didn't provide user session recordings.
4. ContentSquare

ContentSquare was formerly known as ClickTale and is a remarkable heatmap tool that enormous corporate giants widely use. Some of them include Abercrombie & Fitch, Walmart, etc. This software offers heat mapping and provides experience optimization through session recordings, form analytics, funnels, etc.
ContentSquare provides information on several types of heat maps through session recordings. Some of the variants include mouse movement maps, click maps, attention maps, etc. Further, the session recordings are used for replaying how the visitors establish engagement with your website.
When you sign up for the conversion funnels of this heatmap software tool, you can deliberately increase conversion rates. Further, form analytics allows you to monitor the behavior of your potential customers as well. That's how you can gain better insights into your Return on Investment from all online platforms. So, faster growth, customer agility, and 100% consumer satisfaction is what you get from ContentSquare.
Pros:
- Easy to use
- The modules and individual tools provide quick and clear answers.
Cons:
- It is challenging to schedule the export of reports to PDF files or to email them frequently.
5. Mouseflow

This is probably the best heatmap software for A/B testing, thereby identifying user behavior and web analytics. Here, you can construct click, scroll, and motion heatmaps for establishing connections, thereby eliminating uncertainties. Besides, a Session replay function allows you to watch your visitors in action.
With Mouseflow, you can build unique funnels and retrieve abandoned forms. And this can be easily done by gathering accurate feedback and statistics from several feedback campaigns. The heatmap software also provides aid in informing all corporate activities, including both analytics and marketing.
Mouseflow is the perfect software for you as well as your organizational team. It can handle your organization’s marketing needs, track analytics goals, help you create unique UX interface, and also measure CRO. You can also develop and build the right product with exceptional features that ensure seamless transitions between tasks.
Pros:
- If you need to streamline site activities, Mouseflow would prove to be the most functional software there as well. Whether you deal in technology and software, pharma and healthcare, ecommerce, insurance, or finance, this software can help you in myriad of ways.
- Additionally, it assists in identifying and improving the site's flow and assists in directing users to particular areas of interest.
Cons:
- Few data visualization opportunities.
Choose SquidVision : The Smartest Way to Increase Conversions

So, revenue tracking is important and you need the right tool and software for that. SquidVision is probably one of the best heatmap software tools that seamlessly help you track revenue. In a nutshell, you can easily determine the revenue your web page generates with every button and link clicks.
Unlike the majority of the best heatmap tools, SquidVision enables you to track images, links, and buttons. Further, the heatmap software tool converts the same, thereby bringing in more money. Thus, the company of heat maps prefers calling them "revenue heatmaps."
We can rightfully state that this heatmap software is typically an x-ray vision for the revenue derived from your web page. You can easily keep track of user interaction and determine which links and buttons can identify conversion leaks and turn them into money. These are the major features of heatmaps.
Some other key features of SquidVision, the best heatmap software, are:
- The click-tracking heat maps allow you to click data on every link on a page.
- Obtain revenue data for every link on a web page.
- Conversion funnels and heatmap tracking remain connected to each link and button.

There can be nothing worse than a CTA button not obtaining potential customers to act. The conversion rate optimization platform SquidVision enables you to determine whether your Call to Action buttons are functional. Thus, within a few days, the best heatmap software tool exposes all the bad and unresponsive CTAs.
Further, the free heatmap software allows you to look into the $ value of CTAs within your blog content. The best free heatmap software is also working on introducing a new user session where you can create detailed heatmaps. Thus, heat mapping lets you determine which click map features are generating the highest revenue.
So, are you ready to get started? Create heatmaps and start heatmap tracking revenue and conversions of all links and buttons on your mobile apps and website. You can quickly check out the pricing from the site.
Click here to commence tracking revenue on your website now!

Adam White
Adam White is the co-founder of SquidVision and Serpple.com, the best Google rank tracker on the planet. He loves talking about about business growth. In his spare time he writes and directs feature films and lives in Arizona with his wife and seven children. Follow @realAdamWhite on Twitter/X.

